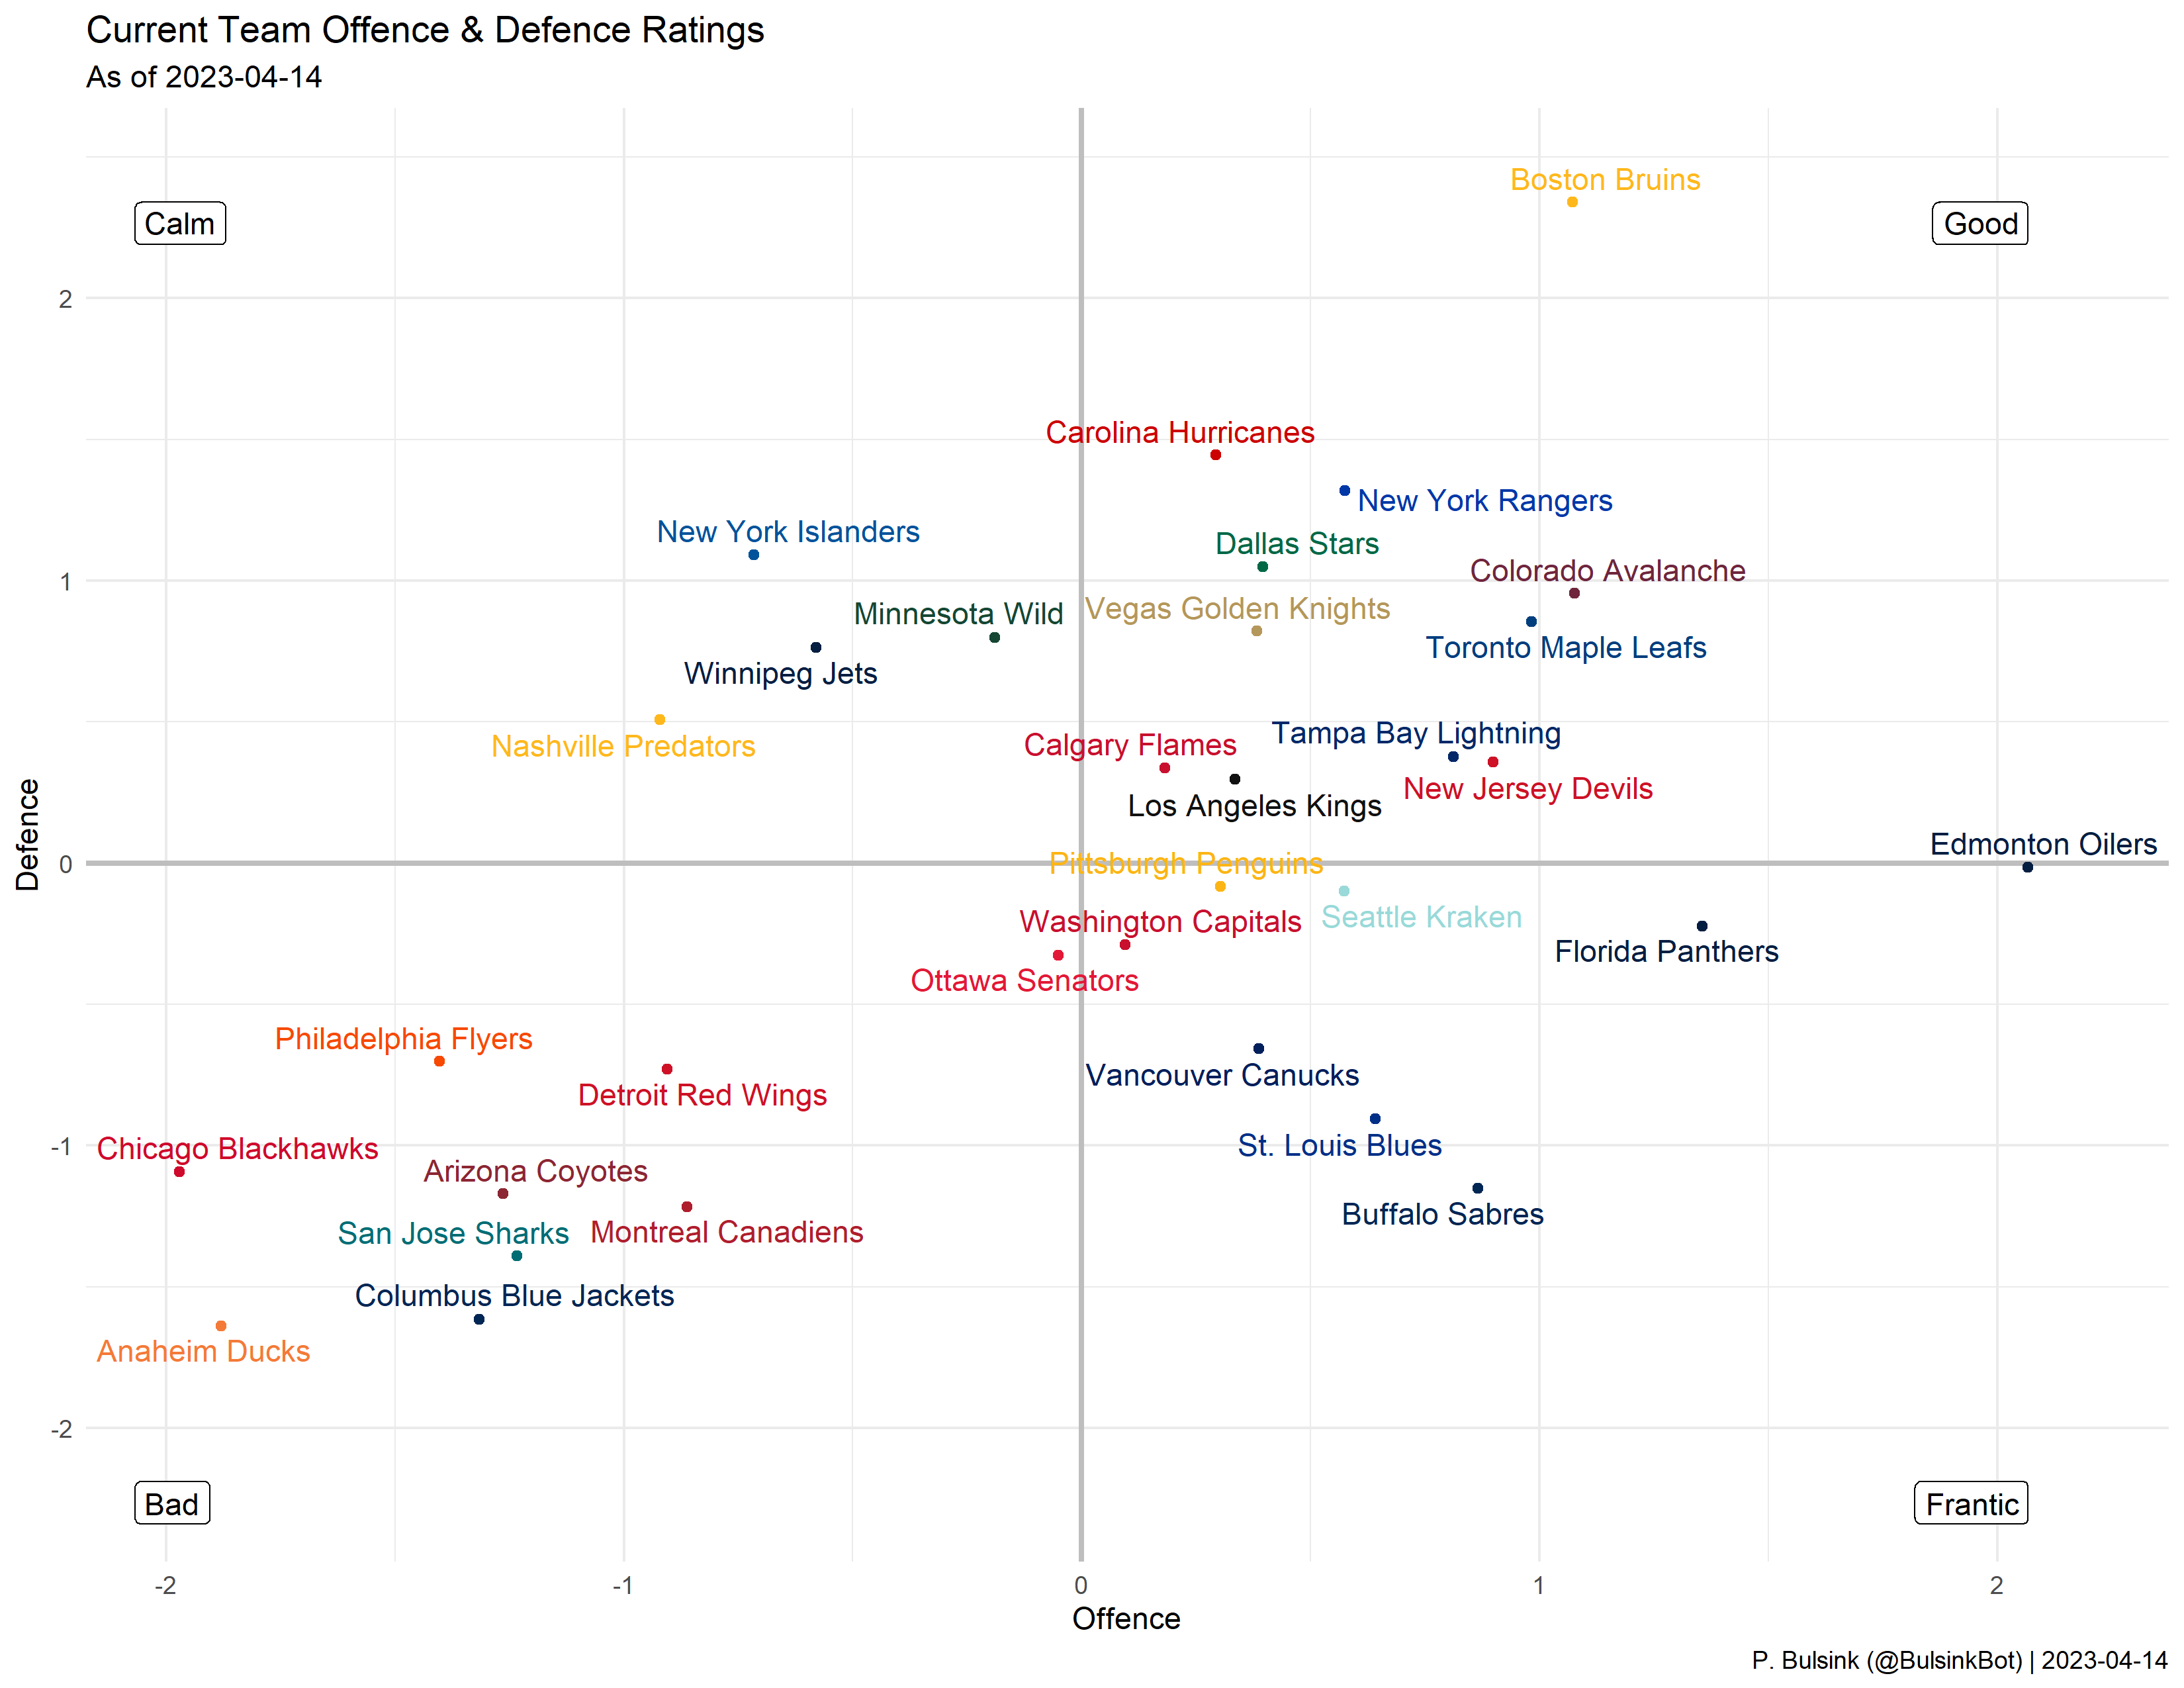
The team strengths are shown below:

Specific team information can be found here:
Team
Philadelphia Flyers
The Philadelphia Flyers' pace through the year, compared to their predicted pace, is shown below:
Their points potential graph is below, with the other teams in their conference.
How they’ve over- or under-performed is here, with the other teams in their division.
Team
Pittsburgh Penguins
The Pittsburgh Penguins' pace through the year, compared to their predicted pace, is shown below:
Their points potential graph is below, with the other teams in their conference.
How they’ve over- or under-performed is here, with the other teams in their division.
Team
San Jose Sharks
The San Jose Sharks' pace through the year, compared to their predicted pace, is shown below:
Their points potential graph is below, with the other teams in their conference.
How they’ve over- or under-performed is here, with the other teams in their division.
Team
Seattle Kraken
The Seattle Kraken’s pace through the year, compared to their predicted pace, is shown below:
Their points potential graph is below, with the other teams in their conference.
How they’ve over- or under-performed is here, with the other teams in their division.
Team
St. Louis Blues
The St. Louis Blues' pace through the year, compared to their predicted pace, is shown below:
Their points potential graph is below, with the other teams in their conference.
How they’ve over- or under-performed is here, with the other teams in their division.